
This Reference Case is intended to be used by both economists and non-economists. To assist, a glossary of terms related to cost estimation is included in Appendix 1. In some cases, economists use terminology in different ways. Where this is the case, we have described this and identified the way in which we have used the term in the Reference Case in the glossary. There are, however, some issues and concepts that are particularly important. We therefore highlight the concepts, definitions, and terminology that are most critical to understand when using the Reference Case.
Throughout this document, we use the term “costing” as a short way to describe the estimation of cost of health interventions or services in a specific context (location, time period, population, and other details discussed in later sections). However, there are several different types of costs, and these are described below.
Firstly, it is important to be clear on the difference between ‘economic’ and ‘financial’ unit costs. The principles and methods specified in the Reference Case state that different types of costs are appropriate for different purposes, and it is essential that the type of cost is reported.
Financial costs capture the resources that are ‘paid’ for. They are thus contingent on the extent to which payment is made for the resources used. In cases where resources are donated, they would not be included in financial costs. Thus, financial costs can be generalized only across settings with similar payment structures. Also, since all resources (even donated) are paid by someone, financial costing implies a specific payer perspective – i.e., the financial cost from the point of view of an identified person, program, or organization.
Financial costs can reflect what is planned to be spent (financial costs for budgeting) or what has been spent. Financial costs, however, are also distinct from expenditures in how they represent monies that have been spent. In any one year, financial costs represent the annual cost of capital inputs “smoothed out” across the years of use of that input, in contrast to ‘lumpy’ expenditures that record cost at the year of purchase of the capital input.
In some guidelines, the term fiscal cost is used. Fiscal cost is a specific term used to describe costs incurred by public institutions.
Economic costs aim to capture opportunity costs. The opportunity cost of a health intervention is defined as the value of the highest-value alternative health intervention opportunity forgone. Economic cost therefore aims to capture the full value forgone of all resources used. In well-functioning markets, the price of a resource reflects its opportunity costs. However, in reality prices may not reflect value, and in some cases no market price is available. For example, if in one setting volunteer time is donated, the financial costs of this time may be low, but the economic costs of the labor would consider market salary rates for the same labora.
Unit cost refers to the average cost of an intervention, service or output. The phrase ‘Unit cost’ is also sometimes used to describe the cost of a specific input, such as ‘cost per test kit’. For this Reference Case, the cost for a unit of a specific input or resource is referred as to the ‘cost of an input’ or ‘the price of an input’.
There are many different types of health interventions, services or outputs. Health service ‘outputs’ can differ from per person reached by a public health strategy, to per person on a course of treatment, and to delivering one consultation or diagnostic test. The term ‘unit cost’ can be used to define the average cost of any of these. However, to support comparability when standardizing unit costs, some further clarity is required for each intervention. Defining both the intervention and its outputs to be costed is complex, as there may be a range of hierarchical outputs, and therefore to provide clarity, we adopt the following terminology:
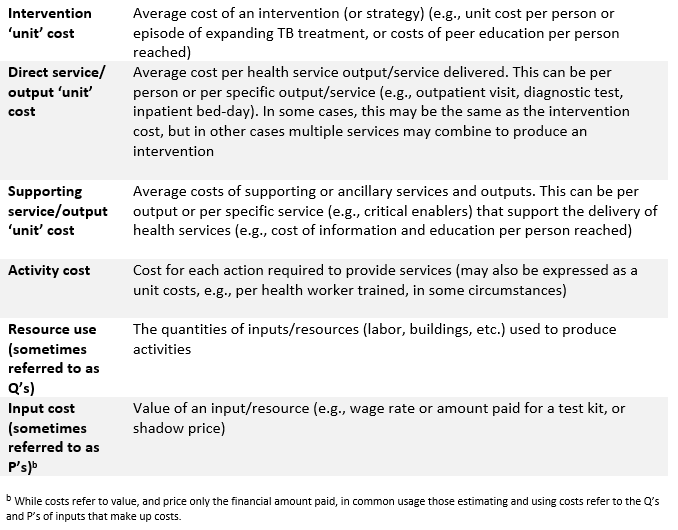
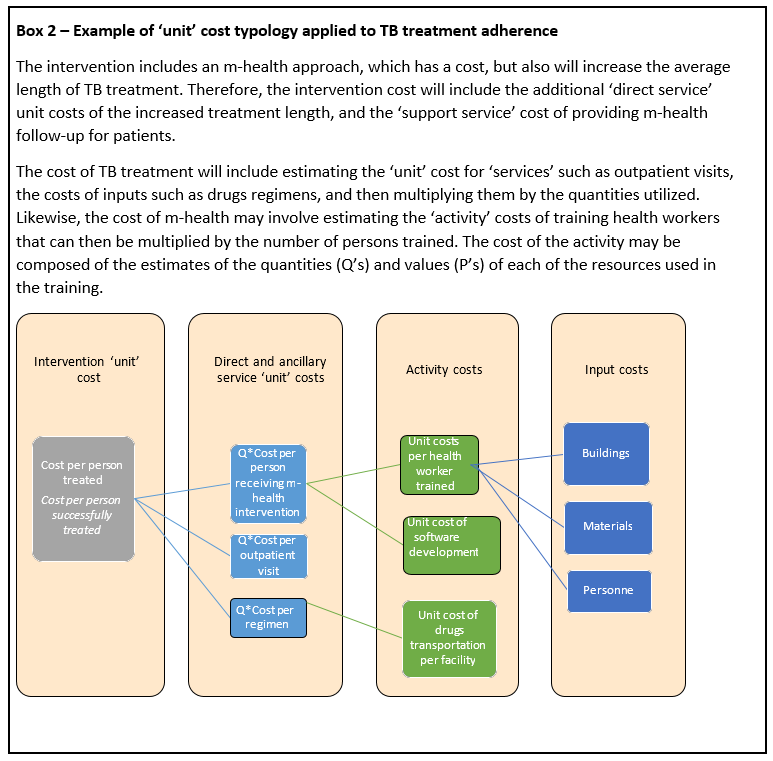
Not every costing will involve such complexity, and sometimes the analyst will need to concentrate on estimating the unit costs of services only or specific activities. However, it is important to note that ‘unit’ costs may be very different depending on whether they are reporting intervention, service- or activity-level costs, and thus present challenges for standardization and understanding for both users and producers of cost data. Appendix 3 demonstrates how these distinctions can be applied to standardize the reporting of unit costs of tuberculosis (TB) programs. Box 2 provides an example, and further examples related to TB are provided in Appendix 3.
Unit (or average) costs represent the total cost of producing a service divided by a given level of unit of intervention, output or service. ‘Unit’ costs can be measured across a whole program or for a specific site. As intervention, service or output levels increase or decrease, average costs will change. Cost functions describe how cost is determined by input cost, the amount of resources used, and other factors that may modify these such as the scale of production, or other characteristics such as quality. Cost functions reflect underlying production functions that describe how the factors of production, or ‘inputs’, can be combined to produce services and interventions.
An average cost function describes how unit (or average) costs vary as the level of intervention/service increases. Average cost functions exhibit different shapes. In some circumstances, average costs stay constant for all levels of service and intervention provision. However, average costs often vary (sometimes non-linearly) as level of provision of intervention/ service increases. In the short term (referred to as the short run), the amount of some inputs used stays constant, or ‘fixed’, as the level of service provision increases. The determination of which costs are fixed is highly contextual, as the ‘fixity’ of a cost reflects the characteristics of inputs, preferences and constraints faced by managers. For example, in some settings staff costs are fixed as they are governed by overall public employment regulations and limits, while in other settings managers at a local level may be able to vary their staffing numbers at short notice by employing temporary staff. In some cases, costs may also stay constant over different levels of service production as they are ‘indivisible’ – for example, where a hospital needs a minimal level of investment in a ward, such as for a laboratory with certain equipment, even to start providing services. In this case, whether one patient or a high number of patients are seen, a large proportion of cost will remain fixed.
At low levels of production, fixed costs may be spread across a low number of services/outputs, and so the average cost is relatively high. As production increases, fixed costs are spread across more persons and average costs decrease.
There are other reasons why an average cost curve of providers may slope downwards, which may still apply in the ‘long run’ where the quantities of all inputs can be changed by managers, and all inputs and costs are ‘variable’. In the long run, as volumes of services increase, a downward slope of the U-shape cost curve may also occur. Relatively large volumes of service provision may enable improved service organization and ‘learning by doing’ within providers, resulting in a more efficient input mix. However, at very high levels of service provision, the production process may become challenging. For example, large hospitals may have such a complex service mix that they become difficult to manage, and average costs may start to rise, corresponding to the rising part of the ‘U’. Whether this happens in practice will depend on the specific service and how the management of services is organized.
Taking a national perspective, average costs may also change with the scale of population coverage. Initially programs may also benefit from decreasing unit costs as some costs, such as program management, are shared over increasing volumes of service provision. However, there may also be a level of volume at which average costs increase again, due to the complexity of large-scale program management. Larger programs may also have to deliver services through increasingly small providers (with higher costs than larger ones), as they reach more remote locations. Likewise, the average costs of supervision and drug supply may rise as programs aim to cover more difficult-to-reach groups.
Therefore, theoretically, many global health services and interventions are hypothesized to have a production process initially exhibiting ‘economies of scale’, where average costs decrease as sites and/or programs expand. At a certain level, average costs may also begin to increase or exhibit ‘dis-economies of scale’. However, the empirical evidence to support arguments of ‘economies of scale’ in health services remains weak and varies by service. Therefore, while both this Reference Case and the iDSI Reference Case recommend the use of cost functions where available, empirical validation is often required before deciding on a specific form of cost function. Where there is none, the use of a single unit cost is accepted for most costing purposes. Nevertheless, it is important that those who measure and report ‘unit costs’ understand that the cost they are observing may be only be a good estimate in the context of the scale that it is produced, and any inference drawn should reflect this. Moreover, if the cost is to be transferred to other settings, those reporting costs need to provide sufficient information on context, such as the levels of service production. For further explanation of the term economies of scale, please refer to the glossary.
A second critical issue that determines ‘average costs’ is the way in which unit cost of a service varies dependent on the other services it is delivered with. ‘Economies of scope’ exist where providers deliver services more cheaply where multiple services are delivered jointly. This efficiency gain can be due to improved sharing of ‘indivisible costs’ such as overheads, or, as with economies of scale, through aspects like joint learning (sharing clinical teaching services and provision is an example of this). As with ‘economies of scale’, while there is a strong intuitive case that the joint production of services may reduce the average cost of each service, empirical evidence of the extent of these gains for most global health interventions remains scarce.
Even if no economies of scope are assumed, the joint production of global health services often presents substantial practical challenges as the allocation of joint costs to different services may be required. The allocation of costs is covered in the guidance below, but will always remain difficult. Even if economies of scope are ignored, it is essential that those who measure costs of services that are produced jointly understand that the unit cost being measured may only be a good estimate of a specific combination of services, and any inference drawn should reflect this limitation. Reporting the extent to which the service being costed is integrated or produced jointly is also important.
At present, this Reference Case does not provide methods guidance on the estimation of cost functions, but the methods described in this Reference Case can be used to collect cost data in preparation for such analyses. Further guidance will be issued in this area in the next version of the Reference Case. Briefly, there are several methods to do this. Broadly there are econometric (statistical) methods and more mechanistic models. Statistical methods exploring economies of scale rely on collecting unit costs from a large sample of sites. Time-series data can be used, although rarely so in practice to date, and may better describe the short-run average cost curve (depending on the length of the time series). If services or outputs change over time, however, time-series data may be limited. Key issues in all cost function analyses are the functional form and how to incorporate aspects such as quality. Mechanistic methods rely on understanding the underlying production function, describing how different inputs are used and combining this with detailed cost data. It is anticipated that subsequent versions of the Reference Case will elaborate and make further recommendations on this topic.
* * * * *
In summary, unit costs are at least in part determined by the relationship between inputs and outputs, and may vary by both the level of output (or service provision) and the scope of service provision, both of which are likely to change over time. While in some cases the average cost function for a service or intervention can be characterized using a single unit cost value, in many cases it cannot. If average costs vary, costs at a single point in time, at a specific level of service provision, may have limited usefulness for planning new services and for many other programmatic uses of cost estimates. When referring to ‘unit cost’ estimation, this Reference Case aims to facilitate the estimation and measurement of ‘single’ unit costs; however, the methods used may also assist in providing the data to estimate average cost functions.
Average or unit costs can include all the costs involved in producing a service compared to doing nothing, or the additional cost required to add or expand a service. In economic terms, the marginal cost is the cost of producing one (or small amounts) of an additional unit of output as service levels increase. Marginal costs capture how additional costs change as service levels increase one unit at a time. Marginal costs are also not necessarily constant as levels of service provision and interventions increase. As production increases, the marginal costs of producing one extra output or service often decreases depending on economies of scale, but may, in theory, also increase.
Incremental cost is the term used to describe the difference in cost between two or more interventions or programs, or to compare a change of scale or approach to an intervention to the current provision. Incremental costs are the correct costs to estimate for economic evaluations (see iDSI Reference Case) c that always compare interventions.
While the terms marginal and incremental cost are sometimes used interchangeably, incremental cost is the broader term, and includes marginal cost. Both marginal and incremental (financial) costs will in part be dependent on the extent of fixed costs (in the short run). However, this is more complex in the case when estimating incremental (economic) costs for an economic evaluation. Here, any resource that has an opportunity cost (i.e., it can be used for another purpose) that is different between the intervention and any comparator, even if fixed, would be included. For example, if a new diagnostic requires more staff hours than the standard of care, these staff hours should be costed. Staff will have an opportunity cost that could have been used for another intervention, even if resource use is drawn from current staff downtime. For further discussion of this issue see principle 6.
Terminology to describe costing methods is currently used inconsistently in the literature, e.g., the use of ‘top-down’ vs ‘bottom-up’ costing, and of ‘gross’ vs ‘micro’ costing. These terms are sometimes used interchangeably, and in other cases are distinguished from one another.
Micro-costing focuses on a granular accounting of inputs, whereas gross costing considers only aggregate costs. A micro-costing disaggregates the costs of a specific output into the specific items consumed, such as nurse time and consumable supplies. A gross costing approach simply estimates all relevant costs, typically from program expenditure data, and divides by the associated outputs such as patient episodes. Gross costing may also be done using tariffs and fees17.
In contrast, ‘bottom-up’ or ‘top-down’ refers to the way in which each resource is allocated to the unit cost being estimated. ‘Top-down’ costing divides overall program cost or expenditures, often including those above the service level, by number of outputs to calculate unit cost, while bottom-up costing measures input quantities at the client or activity level. Gross costing is commonly done top-down.
Micro-costing usually has a bottom-up element, measuring both service and resource use directly at the patient level, but may allocate some resources using top-down methods (e.g., administrative overhead). A specific hybrid form of micro-costing is ‘activity-based costing’ or ‘time-based activity costing’. This is not consistently defined as ‘bottom-up’ or ‘top-down’ in the literature. In some cases, it describes a ‘top-down’ process using a set of rules that allocate overall expenditures firstly to activities and then to services18. In other reports, it is described as a bottom-up approach19, which assesses the actual amount of resources to produce each service, usually by identifying activities and the staff time spent, and allocating costs according to this staff time use.